I recently discussed a study in which older people with overweight had a lower mortality risk than those with normal weight. My point was to look beyond the scale to waist circumference and muscle. At the same weight, it matters how much muscle remains and where the fat sits.
In people in their 20s and 30s, another study asked a different question. In 6.31 million young Korean adults, 10-year cancer incidence was higher among those with obesity.
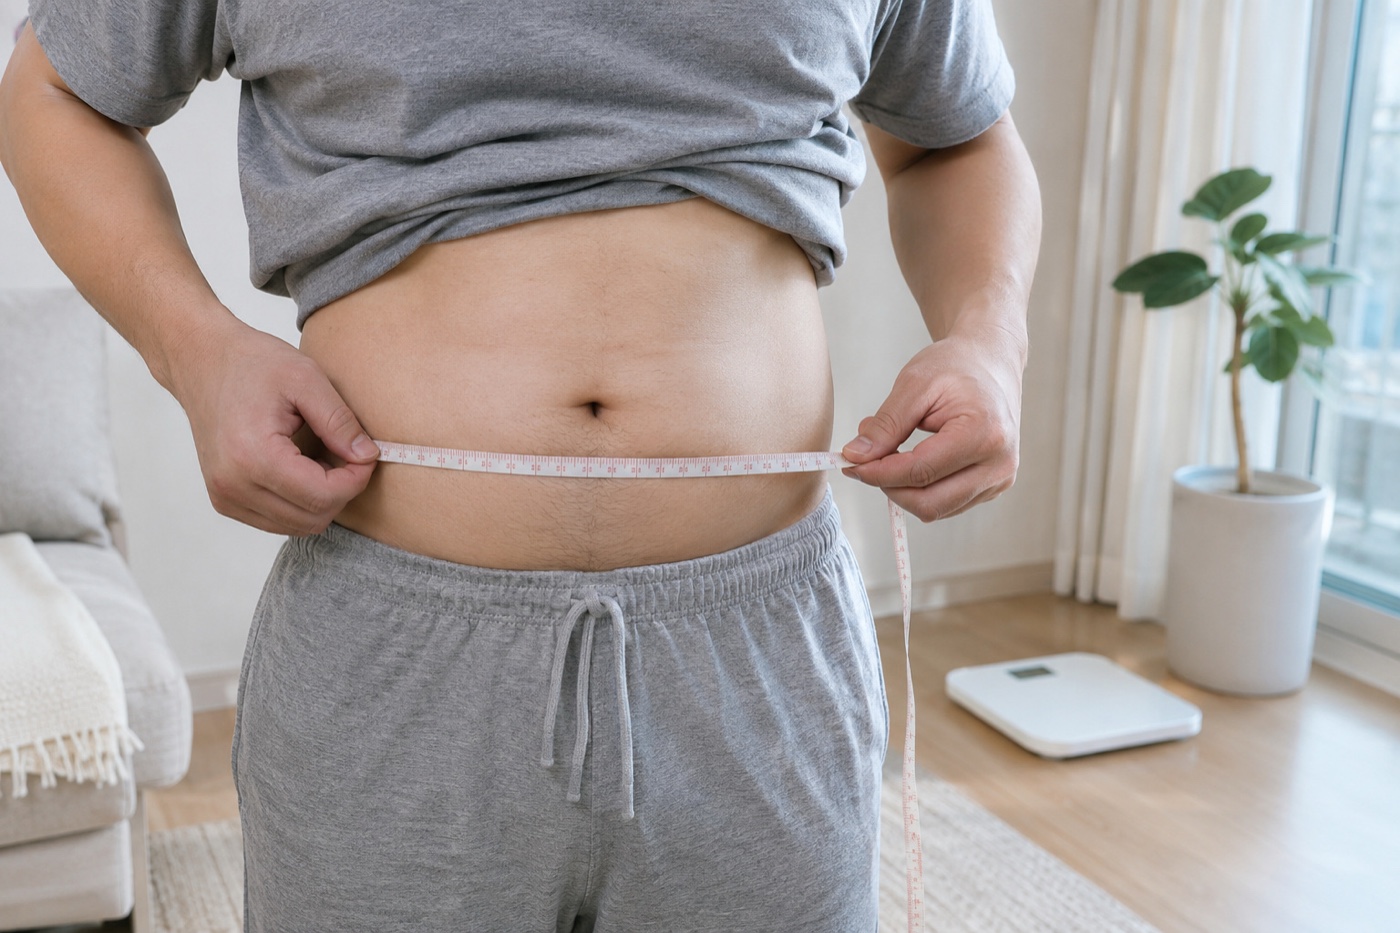
Pay attention to abdominal fat from young adulthood
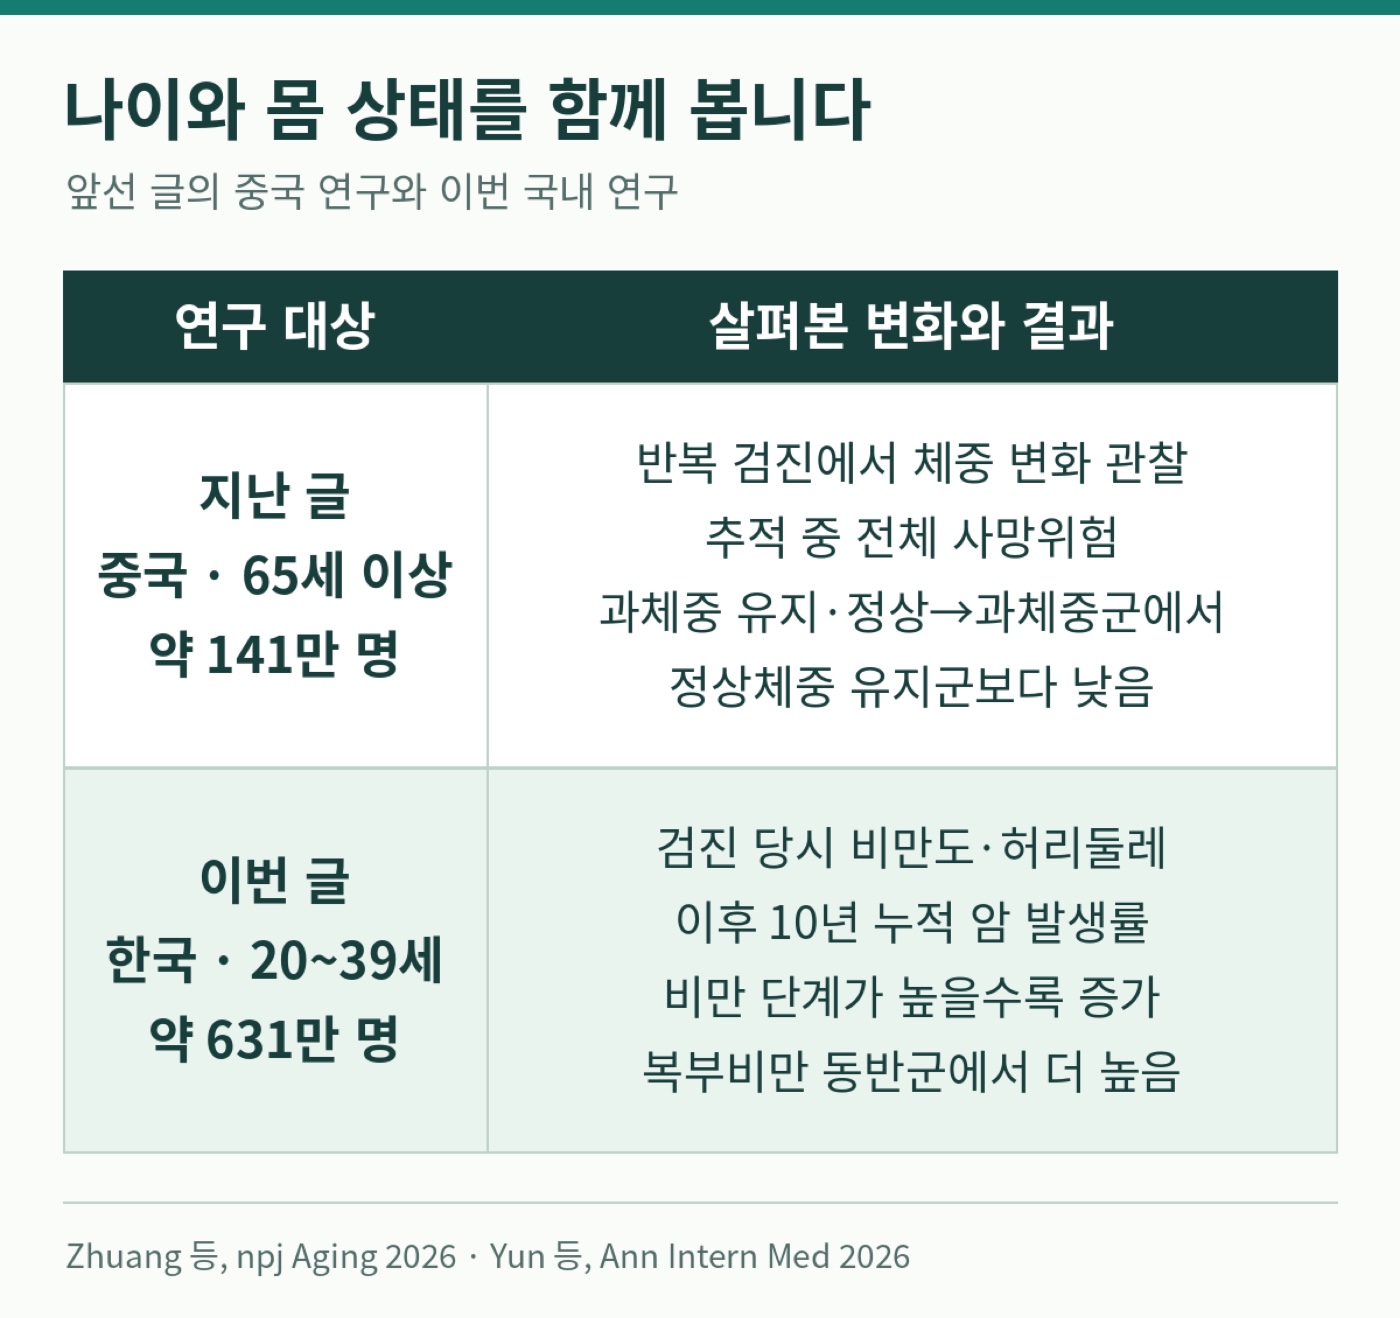
The earlier Chinese study looked at weight changes and mortality in people aged 65 and older. Mortality was lower among those who stayed overweight or moved from normal weight to overweight than among those who stayed at normal weight. When older adults lose weight, I watch for accompanying loss of muscle and deterioration in nutrition, and I look at strength and daily function as well as the number on the scale.
The Korean study instead links body size in young adulthood with subsequent cancer diagnoses. Both pieces point to the same practical question: what is your weight made of at this age? Preserve muscle and function while managing excessive abdominal fat.
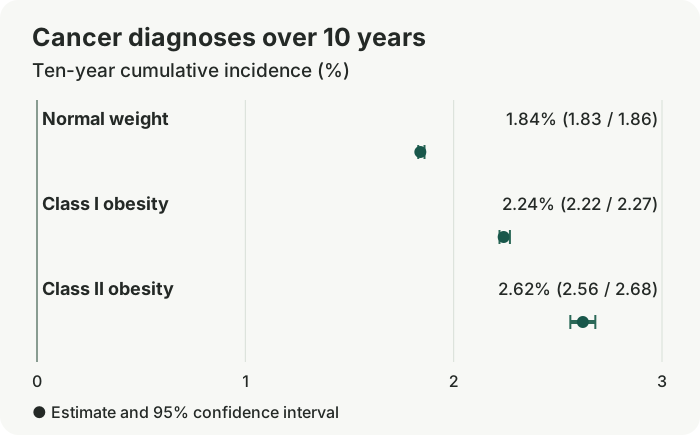
What did 6.31 million adults show after ten years?
The Korean study appeared in Annals of Internal Medicine in October 2026. Researchers followed 6,313,338 adults aged 20–39 who had attended national health screenings, for an average of 11.2 years. They excluded people with previous cancer; 151,893 new cancers were diagnosed. This was an observational study of BMI and waist circumference at screening and cancer diagnoses later, not a test of whether losing weight prevents cancer.
The 10-year cumulative incidence was 1.84% in the normal-weight group, 2.24% in class I obesity, and 2.62% in class II obesity. That is roughly 18, 22, and 26 diagnoses per 1,000 people, respectively. The difference between normal weight and class II obesity was 0.78 percentage points, about eight people per 1,000.
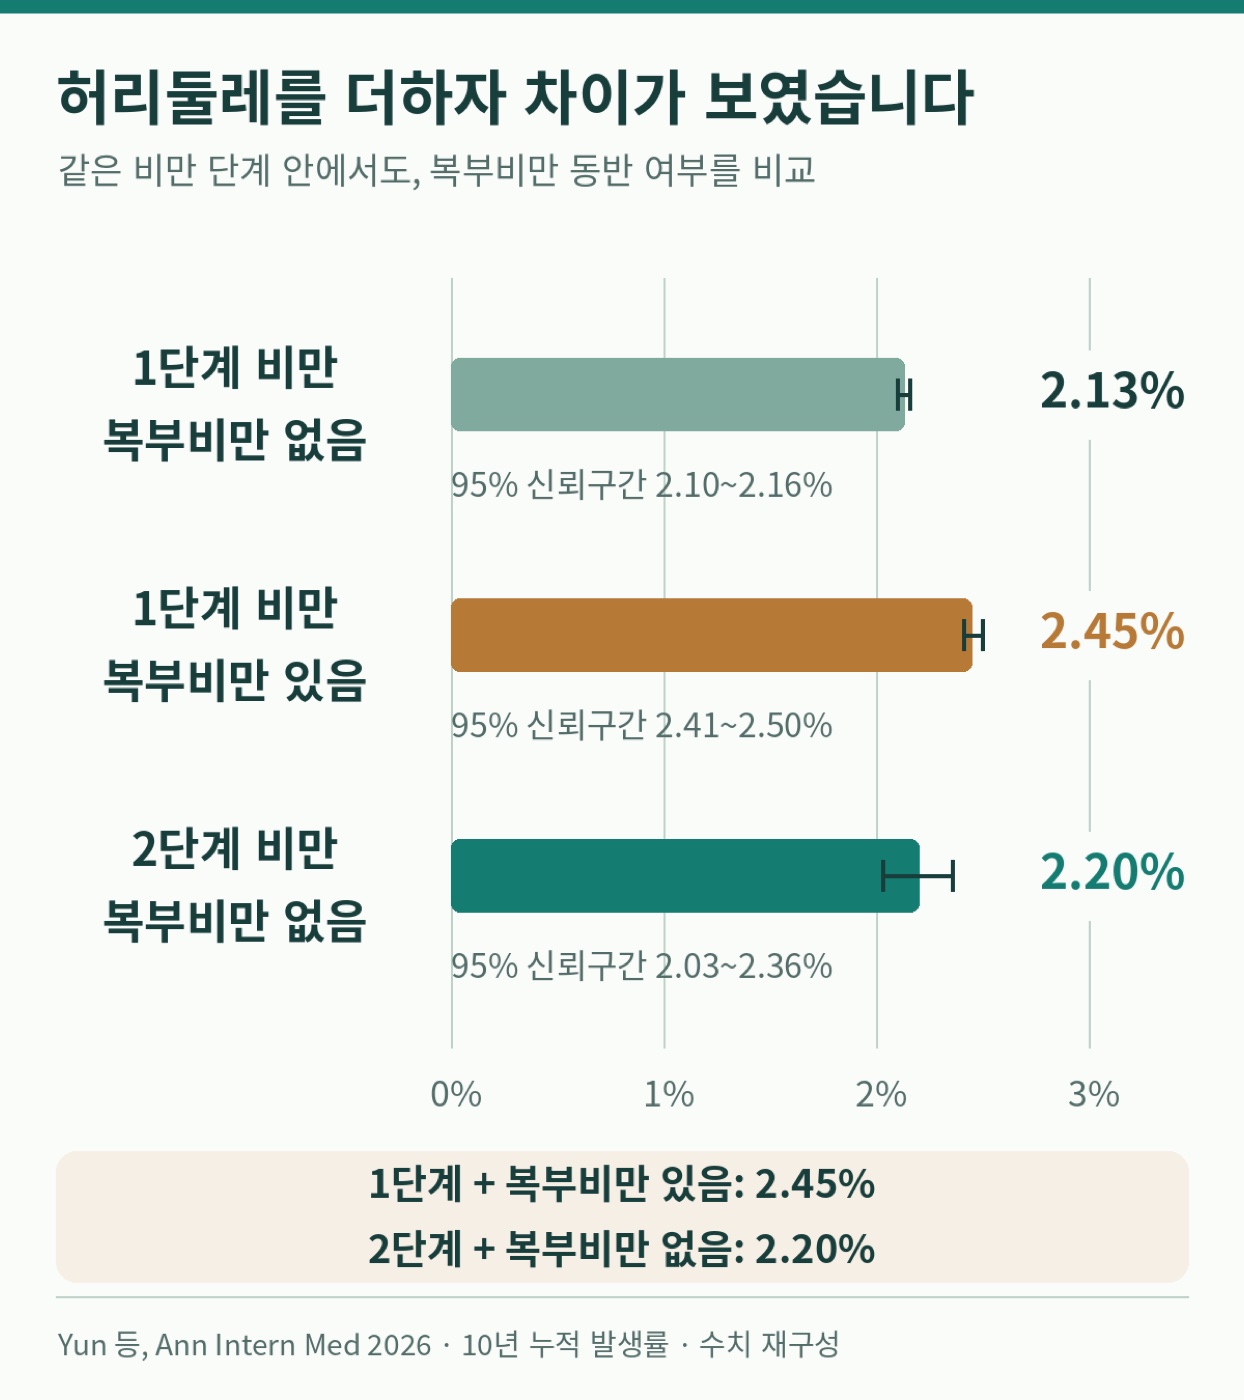
At the same BMI category, waist circumference still mattered
Among people with class I obesity, incidence was 2.13% without abdominal obesity and 2.45% with it. People with the higher BMI category, class II obesity, but without abdominal obesity had an incidence of 2.20%. The result I found most striking was that the class I group with abdominal obesity had a higher observed rate than the class II group without it. BMI alone would hide that distinction.
Why might abdominal fat be connected with cancer?
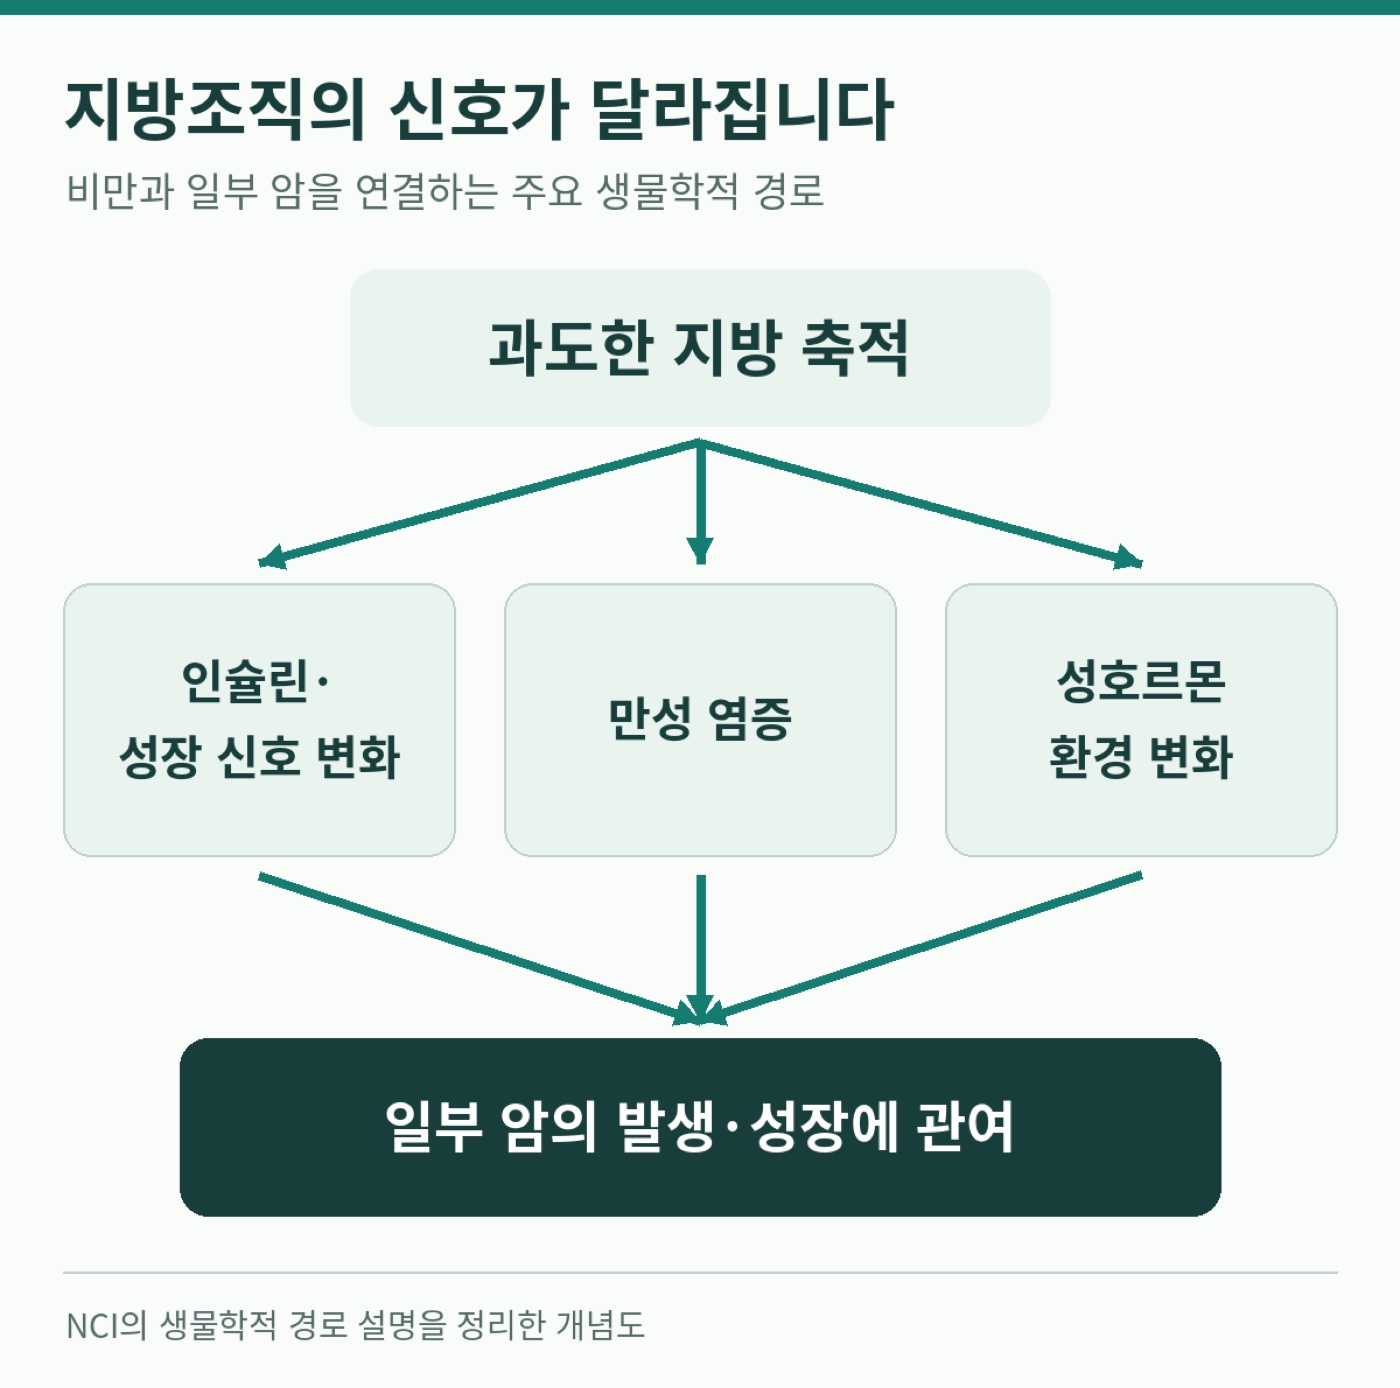
Fat tissue stores energy and also produces hormones and inflammatory signals. Visceral fat around organs is closely linked to metabolic disturbance; waist circumference is an indirect measure of abdominal fat. The U.S. National Cancer Institute describes several pathways researchers are studying: insulin and growth signals, chronic inflammation, and changes in sex hormones. When tissues respond less to insulin, the body may produce more. These related signals can affect how cells grow and multiply; changes in inflammation and hormones may also contribute to certain cancers. A waist expanding over time is worth noticing even when weight is stable.
Keep a tape measure beside the scale
BMI uses height and weight and is a reasonable starting point. Waist circumference, muscle and strength, blood pressure, blood glucose, and lipids give a clearer picture. The Korean Society for the Study of Obesity recommends evaluating body-fat indicators and metabolic health and physical function alongside BMI. For Korean adults, the abdominal-obesity thresholds are 90 cm for men and 85 cm for women. Use locally applicable guidelines if you live elsewhere.
Stand comfortably and run the tape horizontally midway between the bottom rib and the top of the hip bone. Do not suck in your abdomen or compress the skin. Use the same location and similar conditions each time. Measurement guidance
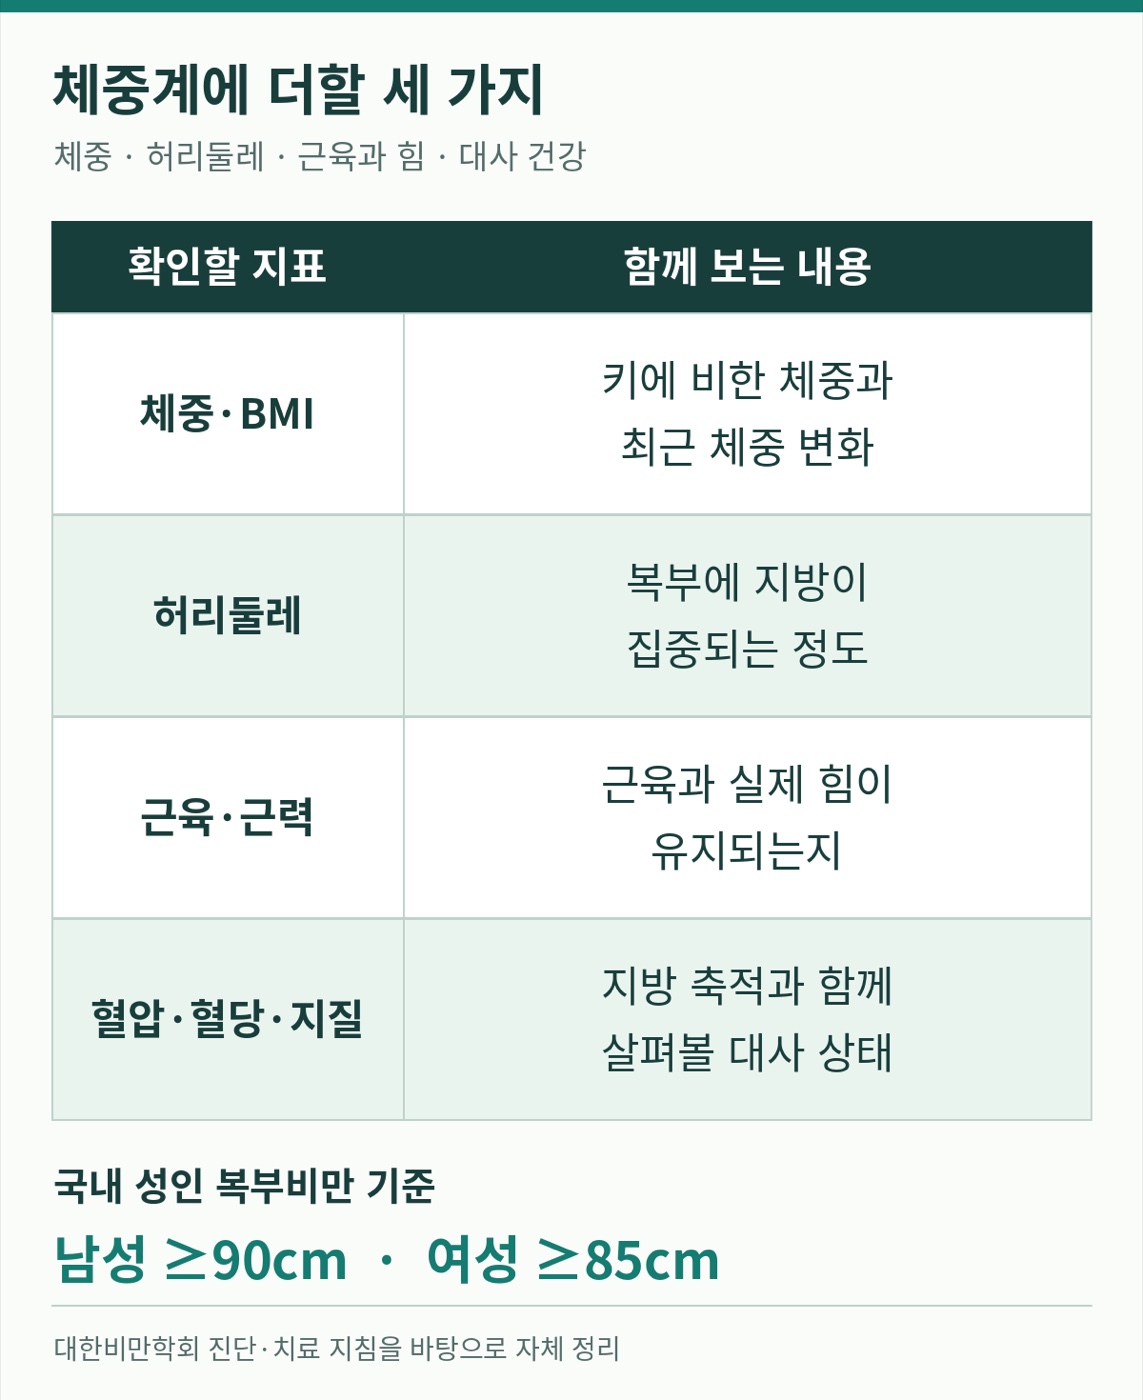
If you are managing your weight, record your waist too and check that your strength and activity are not suffering. Keep the changes in diet and activity realistic for you. My preferred aim is to reduce excess abdominal fat and keep muscle and strength. Start by measuring your waist along with your weight.
Related reading
Does losing weight in later life mean dying earlier? · Korean original
References
1. Yun JS et al. Ann Intern Med. Oct 27, 2026. DOI: 10.7326/ANNALS-25-02612 · 2. Zhuang Y et al. npj Aging. Nov 5, 2026 · 3. U.S. NCI, Obesity and Cancer · 4. Haam et al., Korean criteria, 2023 · 5. Korean Society for the Study of Obesity, revised guideline